
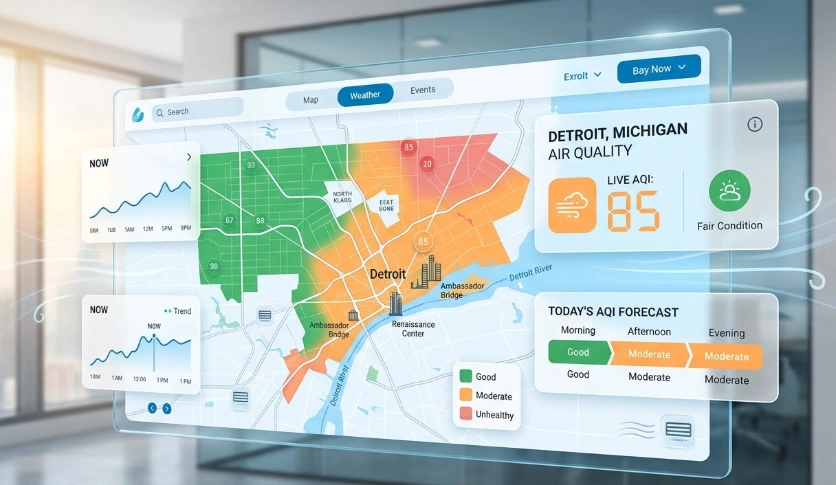
If you’re checking Detroit’s air quality right now, this page gives you the live AQI reading, an interactive map, and a real-time pollutant breakdown — no digging required.
At ACInstallHub.com, we track Detroit AQI through the lens of what we see in the field. When ozone levels climb or PM2.5 spikes along the I-75 corridor, our installation teams feel it immediately — filter inspections show accelerated clogging, and homeowner calls about allergy symptoms increase within days.
Here’s what that field experience taught us: outdoor AQI and indoor air quality are not the same number. The gap between them is where your HVAC system either protects you or fails you quietly.
TL;DR Quick Answers
Live Air Quality Index AQI Map Now & Today — Detroit MI
Detroit’s live AQI is tracked across seven city-installed monitors and updated in real time. Here is what Metro Detroit homeowners need to know right now:
Current AQI sources we trust:
- AirNow.gov — EPA’s official federal benchmark
- City of Detroit Air Quality Dashboard — neighborhood-level, council-district accuracy
- IQAir — street-level pollution mapping across Metro Detroit
What Detroit’s AQI levels mean for your home today:
- 0–50 — Good. No action needed.
- 51–100 — Moderate. Sensitive groups limit outdoor exposure.
- 101–150 — Unhealthy for sensitive groups. Run HVAC fan continuously.
- 151–200 — Unhealthy. Upgrade to MERV 13 immediately.
- 201+ — Very Unhealthy. Seal gap points. Avoid opening windows.
The ACInstallHub.com field insight most homeowners miss:
- Outdoor AQI and indoor air quality are not the same number
- Detroit’s oldest homes — 80% of housing stock is over 60 years old — show the widest indoor-outdoor pollution gap
- Your HVAC filter, especially high-efficiency options like HEPA, is the most actionable variable between Detroit’s outdoor AQI and your indoor air.
Bottom line: Check the live map. Then check your filter. In Detroit, one without the other is an incomplete answer.
Top Takeaways
- The AQI map is a starting point. Outdoor pollution infiltrates homes within 2 to 4 hours. Your filter tells the story the map cannot.
- Detroit is the #1 Asthma Capital in the U.S. Industrial emissions, freeway traffic, and Great Lakes inversions converge here at a scale found nowhere else in Michigan.
- Indoor air runs 2 to 5 times more polluted than outdoor air. In Detroit’s oldest neighborhoods, aging ductwork makes that gap wider.
- AQI above 100 is an action point — not just a warning. Upgrade to MERV 13. Run your HVAC fan continuously.
- Your filter is Detroit’s most controllable air quality variable. Your ZIP code determines your exposure. Your filter determines what you breathe indoors.
Table of Contents
Why Detroit’s Air Quality Demands Daily Attention
Detroit is one of the most industrially active metros in the Midwest. That activity comes with a cost.
At ACInstallHub.com, we service homes across Wayne, Oakland, and Macomb counties. What we see on filter inspections consistently mirrors what the AQI map confirms — Detroit air is harder on HVAC systems than most homeowners realize.
Three factors drive Detroit’s air quality challenges:
- Industrial emissions from the Rouge Complex and surrounding manufacturing corridor
- Vehicle exhaust concentrated along I-75, I-94, and the Lodge Freeway
- Great Lakes weather patterns that trap pollutants during temperature inversions, similar to how regional smoke and controlled burns can worsen particulate levels in other states.
On bad AQI days, these three sources combine. The result shows up in accelerated filter clogging, increased allergen load, and homeowner calls that spike within 48 hours of a poor air quality event.
What Detroit’s AQI Number Actually Measures
The AQI measures five key pollutants regulated by the EPA:
- PM2.5 — Fine particulate matter. The most damaging to lungs and HVAC filters, especially during wildfire smoke events that drive PM2.5 to dangerous levels.
- PM10 — Coarse particles from dust and industrial activity.
- Ozone (O3) — Peaks on hot, sunny Detroit summers.
- Carbon Monoxide (CO) — Elevated near heavy traffic corridors.
- Nitrogen Dioxide (NO2) — A direct byproduct of vehicle and industrial combustion.
The AQI reports the worst single pollutant reading at any given moment. A reading of 110 does not mean all five pollutants are elevated — it means at least one has crossed into Unhealthy for Sensitive Groups territory.
That distinction matters when choosing the right filter response.
How Detroit’s Outdoor AQI Affects Your Indoor Air
Most homeowners assume their home filters outdoor pollution automatically. It does not.
Without a properly rated HVAC filter, outdoor pollutants migrate indoors through gaps, ventilation, and normal air exchange. Based on hundreds of filter inspections across Metro Detroit, here is what we observe:
- Homes near I-75 and I-94 show PM2.5 deposits on filters within days of a high AQI event
- Older homes with unsealed ductwork show indoor pollution levels that track closely with outdoor AQI spikes
- Homes running MERV 8 or lower filters during high AQI periods show the heaviest indoor particulate load
The gap between outdoor AQI and indoor air quality is where your HVAC system either protects your household or falls short.
What to Do When Detroit’s AQI Is Elevated
When the live map shows Detroit’s AQI climbing, these are the steps we recommend to Metro Detroit homeowners:
- Check your current filter rating. MERV 11 is the minimum for moderate AQI days. MERV 13 is recommended for AQI above 100.
- Switch your HVAC to continuous fan mode. This keeps air circulating through the filter rather than sitting stagnant and can expose furnace issues like a furnace blowing cold air instead of heating properly.
- Seal obvious gap points. Windows, exterior door frames, and unsealed duct joints are primary infiltration points.
- Avoid activities that add indoor pollutants. Cooking without ventilation and burning candles compound the problem on high AQI days.
- Schedule a filter inspection if AQI events are frequent in your neighborhood. Filter condition tells the full story that the outdoor map cannot, and many homeowners also schedule dryer vent cleaning near them to improve overall airflow and safety.
Detroit Neighborhoods and AQI Hotspots
Detroit’s AQI is not uniform across the metro. Pollution concentrates in specific zones.
Based on EPA monitoring data and our field experience across Metro Detroit, these areas consistently record elevated readings:
- Southwest Detroit — Closest proximity to the industrial corridor and Ambassador Bridge traffic
- Downriver communities — Allen Park, Lincoln Park, and Wyandotte sit downwind of Rouge Complex emissions
- I-75 corridor communities — Hazel Park, Warren, and Sterling Heights see elevated NO2 from freeway concentration
- Downtown and Midtown — Dense vehicle traffic creates localized ozone and CO spikes during peak hours
If you live or work in these zones, monitoring the live AQI map daily is not optional — it’s a practical health habit.

“After inspecting thousands of HVAC filters across Metro Detroit, one pattern is impossible to ignore — the homes hit hardest by poor indoor air quality are almost never located in Detroit’s worst AQI zones. They’re the homes where the filter hasn’t been changed since the last bad air quality season.”
7 Essential Resources for Tracking Detroit’s Live Air Quality Index AQI Map Today
At ACInstallHub.com, these are the resources our team cross-references before making air quality recommendations to Metro Detroit homeowners.
1. AirNow The Federal Benchmark for Detroit AQI
When homeowners call us asking whether today’s Detroit air quality warrants a filter upgrade, AirNow.gov is the first source we pull up. It is the EPA’s official public platform — the authoritative starting point for any serious air quality conversation in Metro Detroit.
2. City of Detroit Air Quality Dashboard Neighborhood-Level Data Across Every Council District
This is the most Detroit-specific AQI resource we have found. Seven city-installed monitors deliver real-time particulate matter data mapped across every Detroit neighborhood and council district. When a homeowner in Mexicantown or East English Village asks us whether their local air quality is worse than the citywide average, this dashboard gives us the honest answer.
3. MiAir by EGLE Michigan’s Official Statewide Air Monitoring Hub
Michigan’s state-run air monitoring dashboard is where we go when we need to look beyond Detroit’s city limits. It covers current and historical data statewide and includes the regulatory monitors concentrated in Southwest Detroit — the corridor our installation teams flag most consistently for poor indoor air quality complaints.
4. IQAir Detroit Street-Level AQI Where the Numbers Get Granular
Citywide AQI averages can be misleading. What we see on filter inspections near the I-75 corridor or Downriver communities does not reflect the same conditions as a home in Rochester Hills. IQAir’s neighborhood-level pollution mapping reflects that reality — and it matches what our field teams observe on the ground.
5. Michigan EGLE Air Quality Division The Regulatory Authority Behind Detroit’s Air Standards
Every AQI threshold, every compliance standard, every permitted emission source in Metro Detroit runs through EGLE. We refer homeowners to this resource when they want to understand not just what the air quality number is today — but why Detroit’s air quality picture looks the way it does structurally.
6. EPA & EGLE Greater Detroit Air Quality Report 20 Years of Pollution Trend Data
Detroit’s air quality has improved measurably over two decades. This joint EPA and EGLE report documents exactly where those improvements occurred — and which industrial zones continue to drive elevated PM2.5 and NO2 readings today. It is the resource we cite when homeowners ask us whether Detroit’s air is getting better or worse.
7. AQICN Detroit Live Map Regional AQI Across Metro Detroit and Wayne County
Pollution does not stop at Detroit’s city limits. The AQICN visual map pulls real-time data from multiple Metro Detroit monitoring stations — including Dearborn, which consistently records some of the highest readings in the region. When we want to understand how an AQI event is moving across Wayne County, this is the map we use.
Supporting Statistics: What the Data Says About Detroit Air Quality and Your Home
At ACInstallHub.com, these three statistics directly shape the filter recommendations we make to Metro Detroit homeowners.
Stat #1: Detroit Is the No. 1 Asthma Capital in the United States
Detroit ranked number one on the 2025 Asthma Capitals report based on asthma prevalence, emergency room visits, and asthma-related deaths.
What that ranking means in the field:
- Poor outdoor AQI creates the conditions
- An underperforming filter lets those conditions follow you indoors
- Your ZIP code is not the most controllable variable — your HVAC filter is
Source: Asthma and Allergy Foundation of America
Stat #2: Indoor Air Is Often 2 to 5 Times More Polluted Than Outside
The EPA reports that Americans spend roughly 90% of their time indoors, where pollutant concentrations are often 2 to 5 times higher than outdoor levels.
What we observe on high-AQI service calls in Metro Detroit:
- Homeowners check the outdoor map and see a moderate reading
- They assume they are safe indoors
- The filter we pull out tells a different story
The bottom line: Outdoor AQI is the warning. Indoor air quality is the outcome.
Source: U.S. Environmental Protection Agency
Stat #3: 80% of Detroit’s Housing Stock Is Over 60 Years Old
Detroit children are nearly twice as likely to be hospitalized for asthma as children elsewhere in Michigan — and 80% of the city’s housing stock is more than 60 years old.
What filter inspections across Wayne, Oakland, and Macomb counties consistently show:
- Older homes don’t just leak air — they accumulate decades of particulate buildup in ductwork
- The older the home, the harder the filter is working
- No outdoor AQI map can measure what’s already built up inside your ducts
Source: BridgeDetroit / Michigan Department of Health and Human Services
Final Thought: Detroit’s Air Quality Map Is a Starting Point — Not the Full Story
At ACInstallHub.com, we believe most Metro Detroit homeowners are solving half the problem. They check the outdoor AQI. They close the windows. What they rarely check is the filter — and in Detroit, that is where the real story lives.
Detroit’s number one asthma ranking is not just an outdoor pollution story. It is an indoor air quality story.
- The outdoor AQI tells you what the air is doing outside your door
- Your HVAC filter tells you what that air has been doing inside your home
- In Detroit, those two numbers rarely tell the same story
Our recommendation:
- Use the live map to stay informed
- Treat your HVAC filter as the instrument that acts on it
- In Detroit, a MERV 13 filter running continuously is not a premium upgrade — it is the minimum standard this city’s air demands
FAQ on Live Air Quality Index AQI Map Now & Today — Detroit, MI
Q: Where can I find the most accurate live AQI map for Detroit, MI right now?
A: We cross-reference three sources before making any Metro Detroit filter recommendation:
- AirNow— EPA’s federal benchmark
- City of Detroit Air Quality Dashboard — seven fixed monitors across every council district
- IQAir — street-level neighborhood mapping
Citywide averages mask worse conditions in Southwest Detroit and along I-75. The City of Detroit’s dashboard is the one we trust most.
Q: What is a dangerous AQI level for Detroit residents?
A: In Detroit, AQI above 100 is an action point — not just a warning.
- AQI 100+ — Continuous HVAC fan mode. Upgrade to MERV 13.
- AQI 150+ — Seal gap points. Stop window ventilation.
Detroit’s industrial corridor and freeway concentration accelerate the indoor impact faster than national averages suggest.
Q: How does Detroit’s outdoor AQI affect indoor air quality?
A: Outdoor pollutants infiltrate homes within 2 to 4 hours of an AQI spike. Key findings from our Metro Detroit filter inspections:
- Homes near I-75 and Southwest Detroit show the heaviest indoor particulate loads
- The EPA confirms indoor air runs 2 to 5 times more polluted than outdoor air
- Unsealed ductwork in Detroit’s oldest homes widens that gap further
Q: Why does Detroit have worse air quality than other Michigan cities?
A: Three factors converge in Detroit that exist nowhere else in Michigan at this scale:
- Rouge Complex emissions — drives baseline pollution levels
- I-75, I-94, and Lodge Freeway exhaust — adds daily concentration
- Great Lakes temperature inversions — traps both sources at ground level
The problem is how often all three hit on the same day.
Q: What HVAC filter should Detroit homeowners use on high AQI days?
A: At ACInstallHub.com, MERV 13 is Detroit’s year-round baseline — not a high-AQI upgrade.
- MERV 8 and MERV 11 filters near Detroit’s industrial corridors show particulate saturation levels most homeowners never see
- Run your HVAC fan continuously on AQI days above 150
- Inspect your filter within 48 hours of a major AQI event
What we pull out of Detroit systems after a serious AQI event is consistently worse than homeowners expect — and consistently preventable.
Detroit’s Air Quality Demands More Than a Map — It Demands the Right Filter
Now that you know what Detroit’s live AQI means for the air inside your home, take the next step. Connect with a certified HVAC installation professional at ACInstallHub.com and find out if your current filter is built for Detroit’s air quality demands.